Biotech Stock Event Study
Quantifying FDA-driven stock volatility via cumulative abnormal return analysis
Note that the following study and discussion are all contained in a Jupyter notebook hosted on Github. It should be fairly legible, and in fact this post is just the converted notebook to markdown with a little bit of editing (removing code, removing a few comments here and there, and some extra analysis).
Stick around because there are some interactive plots below. :)
I am currently a postdoc transitioning to biotech and I have a budding interest in quantitative finance, about which I have been reading a fair bit. In particular, I read recently, in the book Inside the Black Box by Rishi Narang, that quantitative (finance) researchers typically avoid biotechnology stocks. The specific passage was:
Third, quants tend to prefer instruments that behave in a manner conducive to being predicted by systematic models. Returning to the example of biotechnology stocks, some quants exclude them because they are subject to sudden, violent price changes based on events such as government approval or rejection of their latest drug.
The goal of this project is to quantify and visualise whether this is actually true, using real FDA approval dates and standard event-study methodology. The study is fairly basic, but I think it does get to the meat of it.
Choice of Stocks
Our goal is to illustrate sudden price moves, primarily from approval/rejection events by governments. For simplicity, and because it is easy to find on their website, I will be looking only at FDA approvals and their effects on stocks found in the Yahoo Finance Python API.
It would be useful to focus on candidates that
- are small, because larger companies (typically) have more diversified pipelines/projects, and
- have a history of these events so that we can easily find them.
I selected a mix of large and small pharma/biotech companies with known catalysts, plus XBI (SPDR S&P Biotech ETF) as a sector baseline:
| Ticker | Company | Reason |
|---|---|---|
| PFE | Pfizer | Large-cap “boring” contrast |
| MRNA | Moderna | Large swings during the pandemic |
| LLY | Eli Lilly | Mostly stable, but Alzheimer’s drug edge case |
| BNTX | BioNTech | COVID-19 vaccine |
| SRPT | Sarepta | DMD gene therapy, concentrated pipeline |
| BIIB | Biogen | Aduhelm/Leqembi Alzheimer’s controversy |
| NVAX | Novavax | Late COVID vaccine, extreme binary event |
| MDGL | Madrigal Pharmaceuticals | Rezdiffra NASH approval 2024 |
| XBI | SPDR S&P Biotech ETF | Sector basket baseline |
Stock Prices
To get started, we visualise the stock prices from 1 January 2018 (a pre-pandemic baseline) up until 1 June 2026 (almost the current date as of writing). As an example, here are the stock prices for Eli Lilly versus Novavax (in USD).
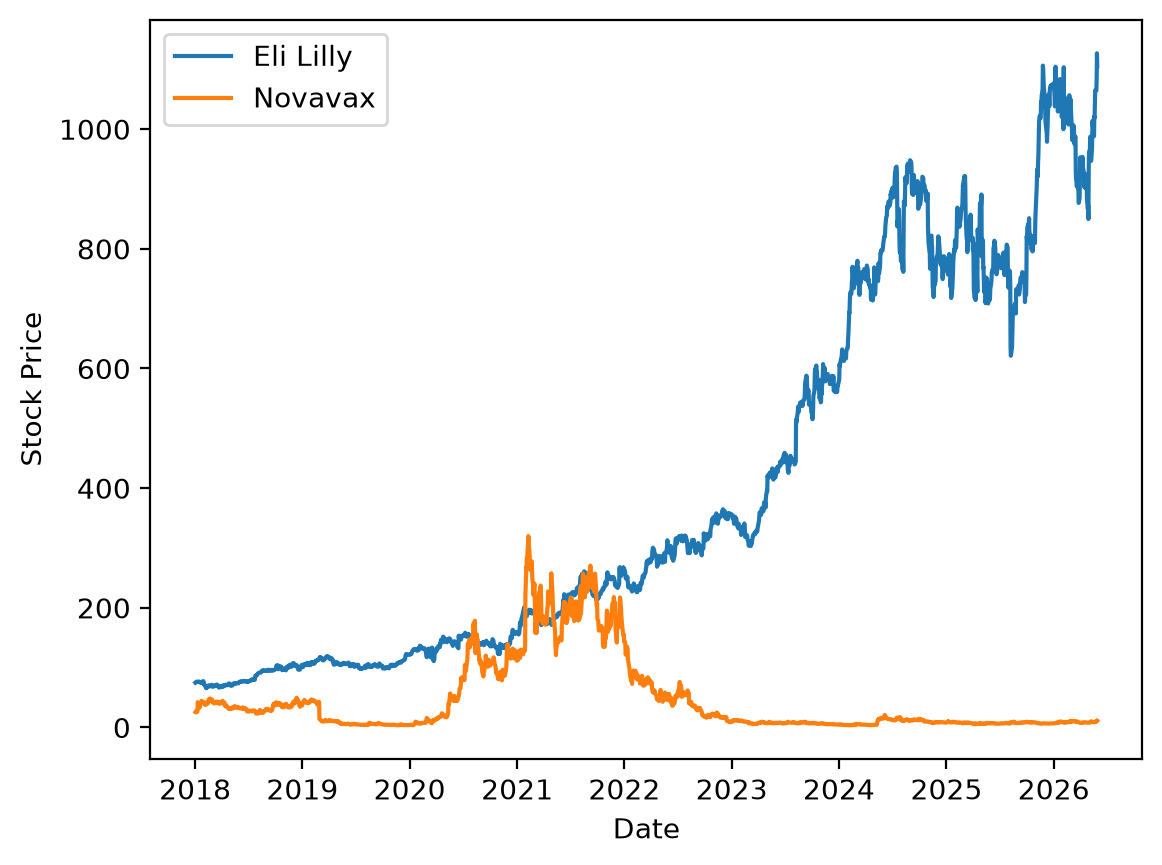
However, as you can see the prices can vary quite wildly. For this study, we normalise them so that all stocks are equal to 100 at 2018-01-01 (start date), so we are really looking at relatively spikes.
Normalised Stock Prices
Stock prices vary enormously in absolute terms (Eli Lilly trades above \$1,000 while Novavax trades around \$10), so direct comparison is meaningless. Prices are normalised to a common base of 100 at the start of 2018 to make relative performance comparable, though in this particular case the differences at each of their peaks is still stark.
Adding the FDA approval dates (dotted vertical lines, diamond markers) on the price chart reveals an interesting pattern: peaks tend to occur before the approval date, not on it. These dates are public in advance (as far as I understand it), and the market anticipates it. Click on any stock ticker in the legend to isolate its events.
Also, if you want the source for all of these events, they are cited in the notebook.
Cumulative Abnormal Return Analysis
The events in the previous plots are quite interesting. Some observations:
- Events don’t necessarily align with peaks, but they typically are shortly after a peak. This makes sense, as markets tend to anticipate and PDUFA dates are public months in advance. Stocks tend to run up before the approval then sell on the news.
- Some peaks are unrelated. Also makes sense: I didn’t capture every event, there is inherent stochasticity, and of course there are many major events not related to drug approvals. Some obvious ones are lockdowns, stimulus, risk sentiments.
A single event on a regular price chart is therefore not enough. Instead let’s consider the cumulative abnormal return (CAR) for each stock. CAR is intended to show whether an event caused a statistically unusual move, and when relative to announcement. This particular study followings a paper from MacKinlay (1997)
Define an event window $[t_0 - N,\, t_0 + N]$ of $N$ trading days around the event date $t_0$, and an estimation window of $W$ trading days ending a short gap before $t_0$.
To separate a stock’s normal behaviour from any event-driven move, we fit a market model using ordinary least squares (OLS) over the estimation window $W$:
\[R_{i,t} = \alpha_i + \beta_i R_{m,t} + \varepsilon_{i,t}\]where $R_{i,t} = \frac{S_t - S_{t-1}}{S_{t-1}}$ (where $S_t$ is the stock price at time $t$) is the daily return of stock $i$, $R_{m,t}$ is the daily return of the benchmark (XBI), and $\hat\alpha_i$, $\hat\beta_i$ are estimated from the estimation window. Intuitively, $\hat\beta_i$ captures how much the stock typically moves with the broader biotech sector.
The abnormal return on each day of the event window is simply the difference between what actually happened and what our OLS predicted:
\[AR_{i,t} = R_{i,t} - (\hat\alpha_i + \hat\beta_i\, R_{m,t})\]Finally, the cumulative abnormal return (CAR) is the running sum of these residuals across the event window:
\[\text{CAR}_i(t_1, t_2) = \sum_{t=t_1}^{t_2} AR_{i,t}\]To understand this, for example, a large positive CAR at day $+5$ means the stock earned significantly more than the market model predicted over those 10 days, implying an event-driven move. CAR also gives some intuition for how long the market took to respond to an event, so to speak, with time $t-t_0$.
The CAR for these stocks (with an estimation window of 200 market days and event window of 5 market days) are presented below. Use the dropdown to isolate individual companies.
Two of the clearest results are Biogen’s Aduhelm Alzheimer’s treatment approval (which was highly controversial and surprising due to the drug’s apparent lack of efficacy) and Sarepta’s DMD expanded approval (June 2024): CAR jumps approximation significantly on the day or just after approval and holds. Here small companies experience a large (positive) surprise.
By contrast, the COVID vaccine approvals for Pfizer and BioNTech (not the emergency approval) show near-zero CAR: these were anticipated, so there was no new information and not much abnormal movement, illustrating surprise drives volatility, not just the approval itself. From my understanding, this is the core of what Narang must be getting at.
Outlook
Several extensions would sharpen the analysis:
We have plotted the stock prices for a handful of companies, of varying size, and hard-coded in some major drug approval dates to see how the market reacted. We have also plotted the CAR for these events, which made it clearer for some of the stocks/events. However, there are certainly more ways to study this:
- Perhaps the simplest would be to try a handful of different estimation windows, event windows, and gaps. Event windows should be kept tight to avoid capturing irrelevant events, and gaps in this case may want to be made larger since these FDA approval announcements are typically anounced later than the market appears to react. In my case, I chose numbers that I felt made sense, but a proper study should choose these systematically.
- I may want to use automated event finding, and include rejections in addition to approvals: perhaps there is a public API out there which can be sifted.
- I need a better baseline. One way to validate the significance is to build an empirical null distribution. For example, draw $K$ random “events” dates from a ticker’s price history (outside event date estimate windows). Compute CAR for each such “event” in the same way and use this collection of as a baseline. A real event’s CAR at some day is significant if it exceeds some percentile relative to this empirical distribution. This null distribution would effectively give us “what CAR looks like when nothing happens”.
- The model prediction, while based on an actual academic article, is somewhat naive and could probably be improved. I guess there is a more sophisticated approach than simple OLS (maybe ridge regression?), or some way to reduce autocorrelation.